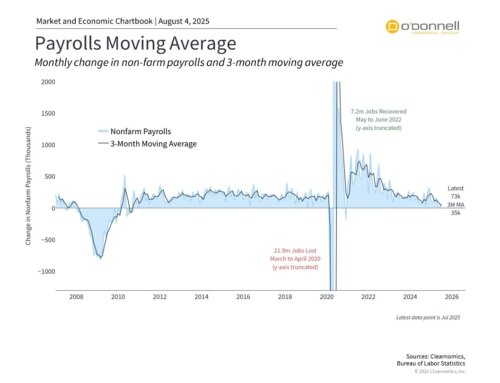
In economics, one might classify statistics that measure overall business activity as either leading indicators, lagging indicators, or coincident indicators.
Leading indicators attempt to point toward a future activity while lagging indicators confirm a trend or pattern that has emerged.
Coincident indicators look to track “real-time” activity to understand where the economy is today. With the rise of apps and faster data management by companies, economists may evaluate a whole host of “coincident indicators” that didn’t exist ten years ago.
For example, activity at restaurants would be considered a coincident indicator. In late May, a popular restaurant booking app reported in “real-time” that the number of seated diners at its restaurants was trending higher, suggesting that the food services industry may be starting to rebound.[i]
Airlines have recently reported more booking, which may suggest Americans feel safer and more confident about the economy. Even the supply of toilet paper turned some heads when Google reported that searches were falling to near-normal levels.[ii],[iii]
With the rise of real-time data, it’s easy to consider throwing away the more traditional “leading and lagging” indicators and focusing instead on new, exciting coincident indicators. But over the years, we’ve learned that a balanced perspective is critical, especially during periods of economic and market volatility.
[ii] MarketWatch.com, May 21, 2020
[iii] MarketWatch.com, May 20, 2020

