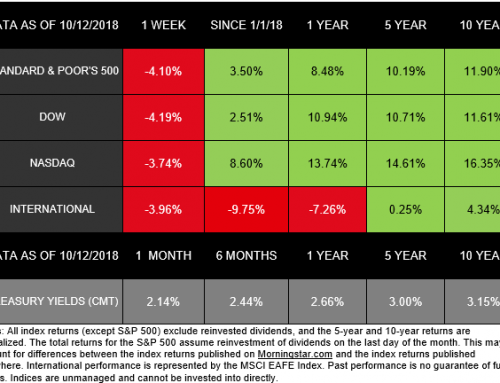
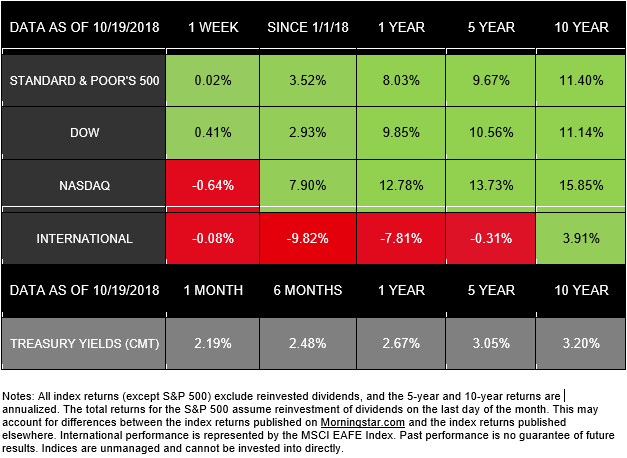
Stock performance was mixed last week as investors considered the impact of interest rates, international affairs and corporate earnings. The S&P 500 gained 0.02%, and the Dow added 0.41% to post its first weekly gains in October. The NASDAQ declined 0.64% and extended its losing streak. International stocks in the MSCI EAFE dropped by 0.08%.
While the final weekly results showed relatively little growth or loss, the week included some volatility. So far, domestic indexes have struggled this month. As of October 19, the S&P 500 and Dow had each lost more than 3% for the month, and the NASDAQ was down 7%.
As we have often discussed in our market updates, volatility may feel uncomfortable, but market fluctuations are normal. That perspective becomes especially relevant in October, which is considered the most volatile month for markets.
Examining October History
Historical performance can’t predict future results. However, we do believe that understanding what makes October unique can help provide context for the current environment.
• Significant market events
For generations, many of the most significant market events have taken place in October, including the crash of 1929 and multiple large drops in 2008. In addition, last Friday, October 19, marked the 31st anniversary of the “Bloody Monday” market crash. On that date in 1987, the S&P 500 lost over 20% of its value.
• Higher than normal volatility
Since 1950, the S&P 500 has experienced more 1% moves in October than any other month. The month has also been the Dow’s most volatile since its beginning in 1896.
• Surprising performance
Despite the large events and high volatility that October can bring, its results may be stronger than expected. For the past 20 years, October has had the strongest performance of any month.
Exactly how this month will end remains to be seen, as we still have a few trading days left. But we hope that understanding how much markets often move in October will help you ride out any future volatility with more confidence. Of course, we’re also here to provide any answers or information you need, so contact us any time.
ECONOMIC CALENDAR
Wednesday: New Home Sales
Thursday: Durable Goods Orders, Jobless Claims
Friday: GDP, Consumer Sentiment
Investing involves risk including the potential loss of principal. No investment strategy can guarantee a profit or protect against loss in periods of declining values.
Diversification does not guarantee profit nor is it guaranteed to protect assets.
International investing involves special risks such as currency fluctuation and political instability and may not be suitable for all investors.
The Standard & Poor’s 500 (S&P 500) is an unmanaged group of securities considered to be representative of the stock market in general.
The Dow Jones Industrial Average is a price-weighted average of 30 significant stocks traded on the New York Stock Exchange and the NASDAQ. The DJIA was invented by Charles Dow back in 1896.
The Nasdaq Composite is an index of the common stocks and similar securities listed on the NASDAQ stock market and is considered a broad indicator of the performance of stocks of technology companies and growth companies.
The MSCI EAFE Index was created by Morgan Stanley Capital International (MSCI) that serves as a benchmark of the performance in major international equity markets as represented by 21 major MSCI indices from Europe, Australia, and Southeast Asia.
The 10-year Treasury Note represents debt owed by the United States Treasury to the public. Since the U.S. Government is seen as a risk-COMPLIMENTARY borrower, investors use the 10-year Treasury Note as a benchmark for the long-term bond market.
Opinions expressed are subject to change without notice and are not intended as investment advice or to predict future performance.
Past performance does not guarantee future results.
You cannot invest directly in an index.
Consult your financial professional before making any investment decision.
Fixed income investments are subject to various risks including changes in interest rates, credit quality, inflation risk, market valuations, prepayments, corporate events, tax ramifications and other factors.
These are the views of Platinum Advisor Strategies, LLC, and not necessarily those of the named representative,
Broker dealer or Investment Advisor and should not be construed as investment advice. Neither the named representative nor the named Broker dealer or Investment Advisor gives tax or legal advice. All information is believed to be from reliable sources; however, we make no representation as to its completeness or accuracy. Please consult your financial advisor for further information.
By clicking on these links, you will leave our server, as the links are located on another server. We have not independently verified the information available through this link. The link is provided to you as a matter of interest. Please click on the links below to leave and proceed to the selected site.
http://performance.morningstar.com/Performance/index-c/performance-return.action?t=@CCO
[1] https://www.msci.com/end-of-day-data-search
[1] https://www.marketwatch.com/story/fasten-your-seat-belt-october-is-almost-here-2018-09-25
[1] https://finance.yahoo.com/video/ryan-detrick-markets-210928786.html?format=embed